1. ACF Excel Charts - Introduction
ACF Excel Charts - Introduction ACF Excel Charts — JSON Options Reference
Top-level chart object Anchor Series (per entry in series[])
Series style (shape & marker) Per-point overrides (dPt) Data labels (per-series and chart-level defaults) Axes (axes.category, axes.value, axes.secondaryValue) Legend Plot Area Color (fill, line) Plot options (plot) Enums (accepted spellings) Examples
(concise) Simple Line chart Stacked, dynamic series chart (Varying series count and column count)
This builds on the existing Excel functions in the ACF Plugin (introduced in v1.7.8.1 ). We’ve made a few design decisions and notes:
There’s a single entry point for charts: EXCEL_PlaceChart(sheetID, jsonOptions).
All configurable parameters live in jsonOptions. Keeping everything in one JSON object makes it easier for developers/designers to reason about and reuse chart definitions.
Typical sequence:
Gather data for the workbook (SQL, APIs, imports, parameters, etc.).
Create the workbook with EXCEL_Create(...) and keep sheet names in variables for easy reference. You’ll receive a workbook ID .
Get the sheet ID for the target sheet (one sheet is already added): EXCEL_GetSheetID(workbookID, sheetNumber).
Populate the sheet with data.
Build the jsonOptions object.
Call EXCEL_PlaceChart(sheetID, jsonOptions).
Close the workbook with EXCEL_Close(workbookID).
For cell-range references, use
EXCEL_SheetAddress(sheetName, -rowFrom, -colFrom, -rowTo, -colTo).
Negative row/column values produce absolute addresses (e.g., $C$1:$C$10). Absolute ranges keep charts linked to the same source data even if the chart is moved or copied.
The anchor element in jsonOptions defines placement: row and col mark the upper-left cell, and width/height set the size.
Excel’s default column width is ~10 “user units” per cell; height uses the same unit (not linked to row height). For pie/doughnut charts, a square (e.g., 50×50) often looks best (legend placement may influence this). For other types, a height of roughly width / 2 is a good starting point.
anchor also supports offsetX and offsetY for sub-cell positioning (including negative values). These offsets are applied against the sheet’s actual metrics at render time, so you can align a chart precisely (e.g., centering within a column).
Below is the reference for the jsonOptions object.
2. ACF Excel Charts — JSON Options Reference ↑
This documents all keys recognized by the current JSON parser for charts.
2.1. Top-level chart object ↑
Key
Type
Accepted/Notes
Default
Status
enginestring
"classic", "modern" ("cx", "2016", "chartex" → Modern)classicOnly classic - others planned.
typestring
column, bar, line, area, pie, doughnut (donut), scatter (xy), bubble, radar, stock, surface, ofpie, waterfall, histogram, pareto, boxwhisker, treemap, sunburst, funnelcolumnImplemented for Column/Bar/Line/Pie/Doughnut/Scatter; others Planned (parsed only).
namestring
Chart title text
(empty) Implemented
anchorobject
See “Anchor” table
—
Implemented
seriesarray
Array of Series objects (see “Series” tables)
—
Implemented
axesobject
category, value, secondaryValue (see “Axes”)—
Implemented (primary); secondary value emitted where wired
legendobject
See “Legend”
—
Implemented
plotAreaobject
Background and outline; see “Plot Area”
—
Implemented
dataLabelsobject
Chart-level defaults applied to series; see “Data labels”
—
Implemented (for supported types)
plotobject
See “Plot options”
—
Mixed (some implemented, others parsed only)
displayBlanksAsstring
gap, zero, spangapPlanned
showHiddenDatabool
Show hidden rows in data ranges
falsePlanned (parsed).
2.2. Anchor ↑
Key
Type
Meaning
Default
Status
row, colint
Start cell (1-based)
0
Implemented
width, heightnumber
Size in ACF “user units”
0
Implemented
offsetX, offsetYnumber
Pixel/user-unit offset inside start cell
0
Implemented
scaleX, scaleYnumber
Scale factors
1
Implemented
2.3. Series (per entry in series[]) ↑
Key
Type
Accepted/Notes
Default
Status
namestring
Series title
(empty) Implemented
categoriesstring
A1 range for categories
—
Implemented
valuesstring
A1 range for values
—
Implemented
xValues, yValuesstring
Scatter/Bubble inputs
(empty) Implemented (for those types)
bubbleSizestring
Bubble size range
(empty) Planned
chartTypestring
Override per-series chart type
(chart.type) Planned for combos (parsed)
axisstring
"secondary" → useSecondaryAxis=trueprimary
Implemented
stackstring
"stacked", "percent", "100", "percentStacked", "stack"noneImplemented (affects grouping + overlap for Column/Bar)
orderint
Render/order hint
-1
Implemented
styleobject
See “Series style (spPr/marker)”
—
Implemented
colorsarray
Per-point fills for category charts
—
Implemented (emits c:dPt)
coloralphanumber
Shared alpha for each colors[i]
1.0
Implemented (applied at parse time)
pointsarray
{ idx, style:{ fill{}, line{} } }—
Implemented (emits c:dPt)
dataLabelsobject
Per-series labels; see “Data labels”
—
Implemented
2.3.1. Series style (shape & marker) ↑
Path
Type
Accepted/Notes
Default
Status
style.fill.colorcolor object
Named/hex; supports alpha, tint, theme, indexed via ParseColorInfoJSON
none
Implemented
style.fill.noFillbool
No fill
false
Implemented
style.line.colorcolor object
As above
none
Implemented
style.line.widthPtnumber
Stroke width in points
0
Implemented
style.line.dashstring
solid, dash, dot, dashDot, dashDotDotsolidImplemented (parsed + emitted)
style.marker.typestring
auto, none, circle, square, diamond, triangle, xautoImplemented for Line/Scatter (parsed + emitted)
style.marker.sizenumber
Marker size (legend follows for line/scatter)
—
Implemented
style.marker.fillcolor object
Fill for marker
—
Implemented
style.marker.lineColorcolor object
Outline for marker
—
Implemented
2.3.2. Per-point overrides (dPt) ↑
Path
Type
Accepted/Notes
Default
Status
colors[]string
"red", "#RRGGBB", "AARRGGBB" (alpha derived)—
Implemented
points[].idxint
point index
—
Implemented
points[].style.fillcolor object
Full ColorInfo support
—
Implemented
points[].style.line.colorcolor
—
Implemented
points[].style.line.widthPtnumber
—
Implemented
2.4. Data labels (per-series and chart-level defaults) ↑
Key
Type
Accepted/Notes
Default
Status
showbool
Toggle labels
false
Implemented
positionstring
center, insideEnd, outsideEnd, left, right, top, bottomoutsideEndImplemented (except doughnut “outEnd” quirks)
separatorstring
Label line separator
(none) Implemented
numberFormatstring
Excel format code
(linked) Implemented
showSeriesNamebool
Include series name
false
Implemented
showCategoryNamebool
Include category name
false
Implemented
showValuebool
Include value
false
Implemented
showLegendKeybool
Include legend key
false
Implemented
showLeaderLinesbool
Leader lines (pie/doughnut)
false
Implemented
2.5. Axes (axes.category, axes.value, axes.secondaryValue) ↑
Key
Type
Accepted/Notes
Default
Status
typestring
text, date, categorytextImplemented
titlestring
Axis title
(none) Planned (parsed)
min, maxnumber
Bounds. The min/max values is rounded to two significant digits, max rounded up, min rounded down.
auto
Implemented
majorUnit, minorUnitnumber
Tick units
auto
Implemented
orientationstring
minMax, maxMinminMaxImplemented
crossesstring
autoZero, min, max, autoautoZeroImplemented
labelAnglenumber
Degrees;
0
Implemented
numberFormatstring
Format code
linked
Implemented (value axis common)
majorTickMark, minorTickMarkstring
none, in, out, crossnoneImplemented
showMajorGrid, showMinorGridbool
Show gridlines
false
Implemented
majorGridlines.line.colorcolor
Gridline color
—
Implemented
majorGridlines.line.widthPtnumber
Width pt
—
Implemented
2.6. Legend ↑
Key
Type
Accepted/Notes
Default
Status
showbool
Show legend
false
Implemented
positionstring
right, left, top, bottom, corner (tr)rightImplemented
overlaybool
Overlay on plot area
false
Implemented
fontnumber
Font size (pt)
(unset) Implemented
fillcolor
Legend background
—
Implemented
linecolor
Legend outline
—
Implemented
2.7. Plot Area ↑
Key
Type
Accepted/Notes
Default
Status
fillcolor
Background behind plot
—
Implemented
linecolor
Outline around plot area
—
Implemented
line.thicknessnumber
line width pt
1 if providedImplemented
2.8. Color (fill, line) ↑
Key
Type
Accepted/Notes
Default
Status
color, rgbString
color names, hex values ARGB (8 hex digits) or RGB (6 hex digits), or 3-digit RGB. Any # sign is stripped off.
—
Implemented
tintNumber
between -1 and 1
1
Implemented
alphanumber
between 0.0 and 1.0 (0.0 = full transparency)
1Implemented
Indexed
Number
Excel indexed colors.
Implemented
2.9. Plot options (plot) ↑
Key
Type
Accepted/Notes
Default
Status
clusteredbool
For Column/Bar
(false) Planned (grouping derives from series stacking today)
gapWidthint (0–500)
Space between category groups
Excel default
Implemented
overlapint (-100..100)
Overlap between series. If stacked, 100 is selected automatically,
By type
Implemented
smoothbool
Smooth lines
false
Planned
firstSliceAngleint
Pie/Doughnut start angle
0
Implemented (doughnut)
holeSizeint (10–90)
Doughnut inner size
(Excel default 50)
Implemented
varyColorsByPointbool
Auto-vary per point. For Pie/Doughnut, if some of the points lack color configuration, this option is automatically turned on. The configured colors pr points overide this setting.
false
Implemented
bubbleScaleint
Bubble scale
100
Planned
showNegativeBubblesbool
Bubble rendering
false
Planned
2.10. Enums (accepted spellings) ↑
Setting
Accepted strings → Enum
LegendPosition left/l, top/t, bottom/b, corner/tr/topright, else right (default).
DataLabelPos center/centre, insideEnd/inside, outsideEnd/outside, left, right, top, bottom.
AxisType date/time → Date; category/cat → Category; else Text.
Orientation maxMin/desc → MaxMin; else MinMax.
Crosses min, max, auto/autozero/zero → AutoZero.
TickMark in, out, cross, else None.
DisplayBlanksAs zero/0 → Zero; span/connect → Span; else Gap.
Stacking stacked/clusteredfalse/stack → Stacked; percentStacked/percent/100/100percent → PercentStacked; else None.
MarkerType none, circle/dot, square, diamond, triangle, x/cross, else Auto.
LineDash dash, dot, dashDot, dashDotDot, else Solid.
SizeRepresents width → Width; else Area.
2.11. Examples ↑
2.11.1. (concise) ↑
JSON({
  type: "column",
  name: "Revenue by Month",
  anchor: { col: 2, row: 5, width: 80, height: 40 },
  series: [
    {
      name: "2024",
      categories: "'Sheet1'!$A$5:$A$16",
      values: "'Sheet1'!$B$5:$B$16",
      stack: "stacked",
      style: { fill: { color: "1F77B4" }, line: { color: "000000", widthPt: 0.75 } },
      colors: ["1F77B4","FF7F0E","2CA02C"],  // optional per-point
      dataLabels: { show: true, showValue: true, separator: "\n" }
    }
  ],
  axes: {
    value: { numberFormat: "#,##0" }
  },
  legend: { show: true, position: "bottom" },
  plot: { gapWidth: 160 }
})
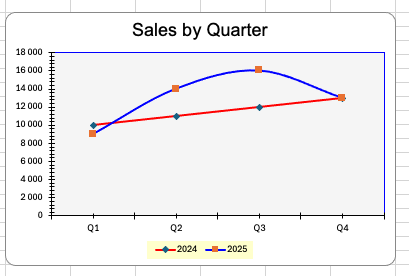
2.11.2. Simple Line chart ↑
Allready populated this:
Excel Test 2
Quarter (Cell A1)
2024
2025
Q1
10 000
9 000
Q2
11 000
14 000
Q3
12 000
16 000
Q4
13 000
13 000
Here is the test-function:
function ChartTest2 ()

  array string hd = {"Quarter", "2024", "2025"};
  array string cat = {"Q1", "Q2", "Q3", "Q4"};
  array int valB = {10000, 11000, 12000, 13000};
  array int valC = {9000,14000, 16000, 13000};


  int cnt = sizeof (cat);
  int i;

  string dir = desktop_directory() + "ExcelTestCharts/";
  string res = create_directory(dir);
  string path = dir+format("TestChart2_%s.xlsx", string(usec()));
  string sheetName = "Sheet1";
  int wb = Excel_Create(path, sheetName);
  int s = Excel_GetSheetID(wb, 1);
  res = ExcelSetReportStyleSheet(wb);

  Excel_setCell(s, 1, 1, "Excel Test 2", "H1");

  Excel_SetColumns(s, 2, 1, hd, "CH");
  int startTable = 3;

  for (i=1, cnt)
    int row = startTable+i-1;
    Excel_setCell(s, row, 1, cat[i], "datoTx");
    Excel_setCell(s, row, 2, valB[i], "dataNum0");
    Excel_setCell(s, row, 3, valC[i], "dataNum0");

  end for
  int endTable = starttable+i-2;

// Place the chart.

chartOptions = JSON(
  "type", "line",
  "name", "Sales by Quarter",
  "anchor", JSON(
    "col", 12,
    "row", 23,
    "width", 60,
    "height", 40
  ),
  "series", JSONarray(
    JSON(   // Series 1
      "name", "2024",
      "categories", Excel_SheetAddress(sheetName, -startTable, -1, -endTable, -1),
      "values", Excel_SheetAddress(sheetName, -startTable, -2, -endTable, -2),
      "style", JSON(
        "fill", JSON(
          "color", "red",
          "tint", 0.25,
          "alpha", 0.5
        ),
        "line", JSON(
          "color", "red",
          "widthPt", 2
        )
      )
    ),
    JSON( // Series 2
      "name", "2025",
      "categories", Excel_SheetAddress(sheetName, -startTable, -1, -endTable, -1),
      "values", Excel_SheetAddress(sheetName, -startTable, -3, -endTable, -3),
      "style", JSON(
        "fill", JSON(
          "rgb", "blue",
          "tint", 0.25
        ),
        "line", JSON(
          "rgb", "blue",
          "widthPt", 2
        )
      )
    )
  ),
  "legend", JSON(
    "show", true,
    "overlay", false,
    "position", "bottom",
    "fill", JSON(
      "rgb", "yellow", "alpha", 0.2
    )
  ),
  "plotArea", JSON(
    "fill", JSON(
      "color", "grey",
      "tint", 0.85,
      "alpha", 0.5
    ),
    "line", JSON(
      "color", "blue"
    )
  )
);
  excel_placechart ( s, chartOptions);
  EXCEL_Close (wb);
  return "OK";
end
Result:
2.11.3. Stacked, dynamic series chart (Varying series count and column count) ↑
// Graph below on sheet 1.

    array string colormap = {
  "1F77B4","FF7F0E","2CA02C","D62728","9467BD",
  "8C564B","E377C2","7F7F7F","BCBD22","17BECF",
  "AEC7E8","FFBB78","98DF8A","FF9896","C5B0D5",
  "C49C94","F7B6D2","C7C7C7","DBDB8D","9EDAE5"
    };

    float chartW = 0.0;
    for (i= 1, DataColumns)
        chartW += cw1[i+2];
    end for

    chartW = (chartW < 50.0?50.0:chartW); // Guard for 1 month chart....
    float xoff = cw1[3]/2.0;

    JSON chartOptions = JSON(
  "type", "column",
  "name", "Periodes - Customer segment",
  "anchor", JSON(
    "col", 2,
    "row", r+3,
    "width", chartW,
    "height", chartW/2.0,
    "offsetX", xoff
  ),

  "legend", JSON(
    "show", true,
    "overlay", false,
    "position", "bottom",
    "fill", JSON(
      "rgb", "yellow", "alpha", 0.2
    )
  ),
  "plotArea", JSON(
    "fill", JSON(
      "color", "grey",
      "tint", 0.85,
      "alpha", 0.5
    ),
    "line", JSON(
      "color", "blue"
    )
  )
);

// Add the series to the jsonOption object.
int cntRows = sizeOf(dataRows);
cntRows = (cntRows>20?20:cntRows); // Guard against color table. Max 20 series.
int endcol = DataColumns + 2;
for (r=1, cntRows)
    int soro = dataRows[r];
    chartOptions["series[]"] =  JSON(
      "name", Excel_GetCell(s1, soro, 1),
      "categories", Excel_SheetAddress(sheet1, -5, -3, -5, -endcol),
      "values", Excel_SheetAddress(sheet1, -soro, -3, -soro, -endcol),//"Sheet1!$B$2:$B$13",
      "stack","stacked",
      "style", JSON(
        "fill", JSON(
          "color", colormap[r],
          "tint", 0.25,
          "alpha", 1.0
        ),
        "line", JSON(
          "color", "black",
          "widthPt", 1
        )
      )
    );
end for

  print string(chartoptions);
  excel_placechart ( s1, chartOptions);